Kohonen's self-organizing feature maps in Processing
Processing
If you haven't used processing, you should spend some time with it. It lowers the bar for 2D and 3D graphics programming without significantly restricting your creativity or flexibility. In addition to what you'll find below, here are some beautiful examples of what's possible, complete with source code. The examples on this page use processing.js to render in the browser without the JRE.Kohonen's maps - the introduction
Kohonen's self-organizing maps are a type of neural network used to classify inputs of consistent but arbitrary dimension. The most popular unsupervised training algorithm, it does not require a 'teacher' to direct the outputs. It does require training on a set of data. Training is where the magic happens.Some sources to flesh out my curt introduction:
Kohonen's maps - the algorithm
A thorough introduction requires good diagrams, equations and such. This is best left to the links above and the others you'll find via your google search.In brief:
- Allocate an m x n array
- For each node in your array, allocate an N element array with initial values randomly distributed between 0 and 1. N is the number of dimensions of your input. These are your initial weights.
- For each training input vector:
- Select the node with the closest matching weights. Simple Euclidean distance is effective: sqrt( (x1 - x2)^2 + (y1 - y2)^2 ... )
- Update the weights on this node
- Update the weights on this node's neighbors
"Hello, world" of SOMs
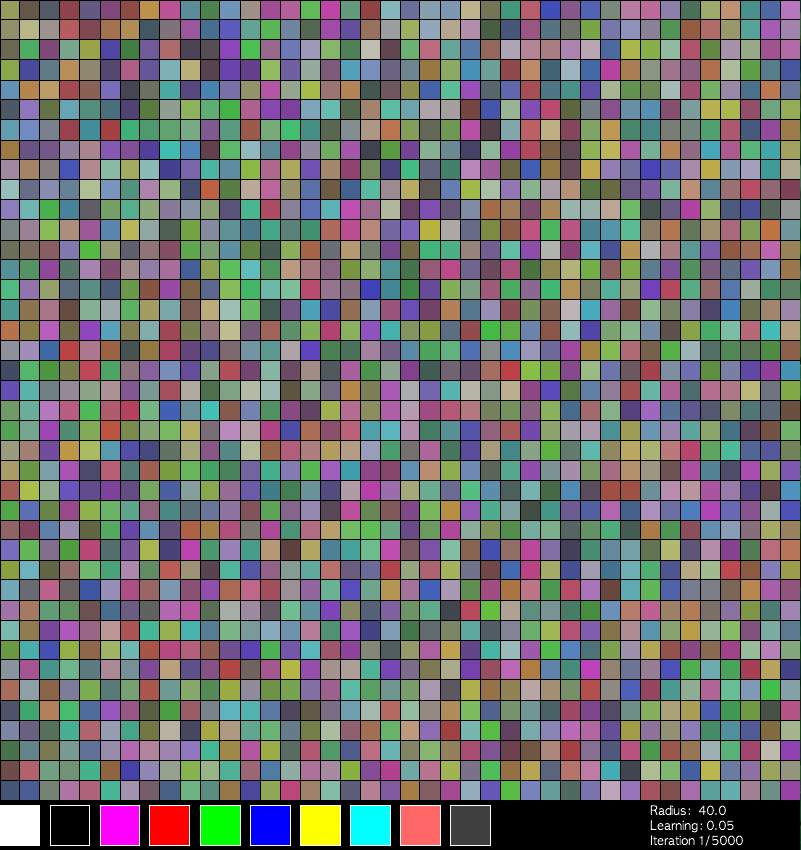
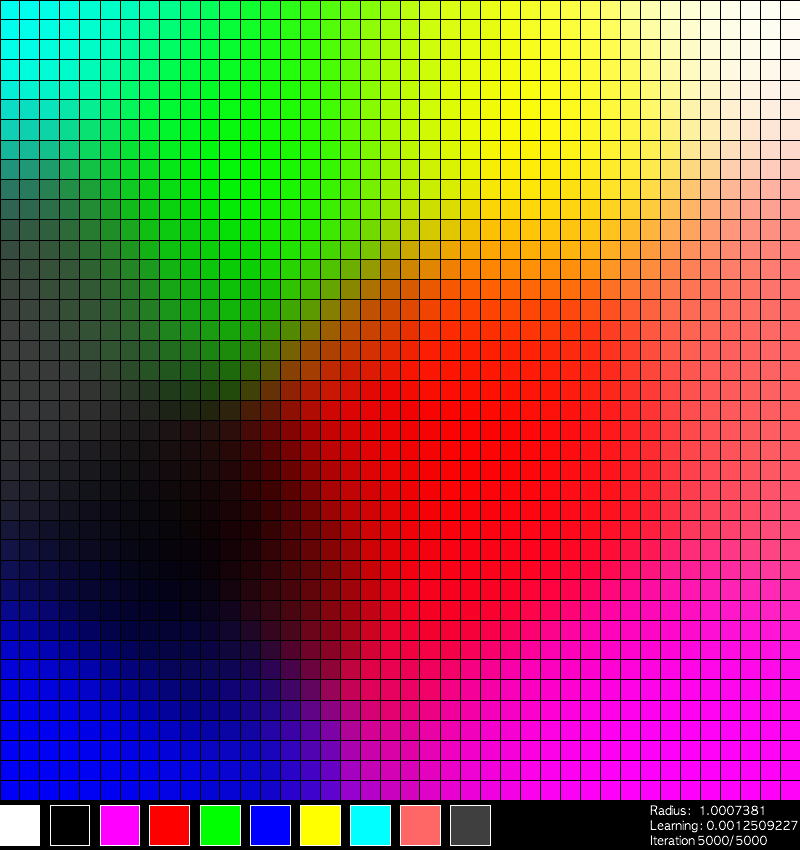
Colors
Using a 40x40 map of nodes and a 3-dimensional input, I graph each node according to it's place in the array. I then color each node according to the value of the inputs, in standard RGB color scheme - the first element is the Red value, the second Green, the third Blue. Each node was initialized with random values for each of the three values, resulting in a rather motley view:The 10 colors across the bottom of the screen are the 10 training inputs. I select one of these at random and feed into the map for 5000 iterations. The final map:
Click to give focus, then hit 'g' to Go, 'p' to pause or 'r' to Reset. Source here.
Lines
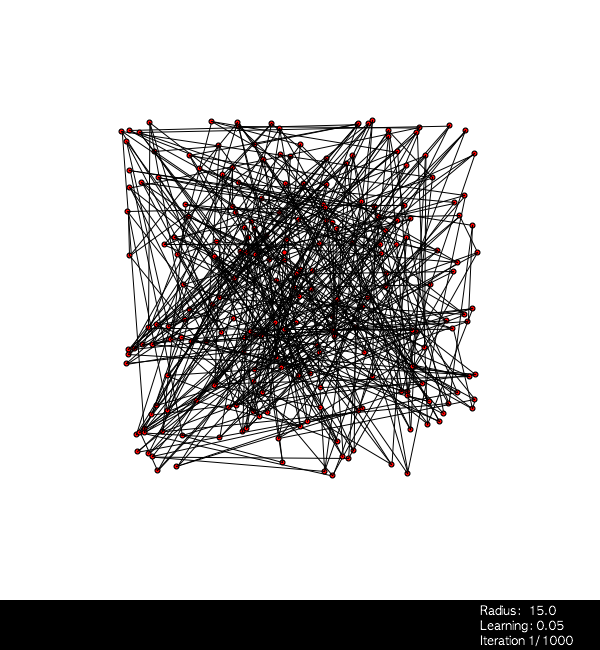
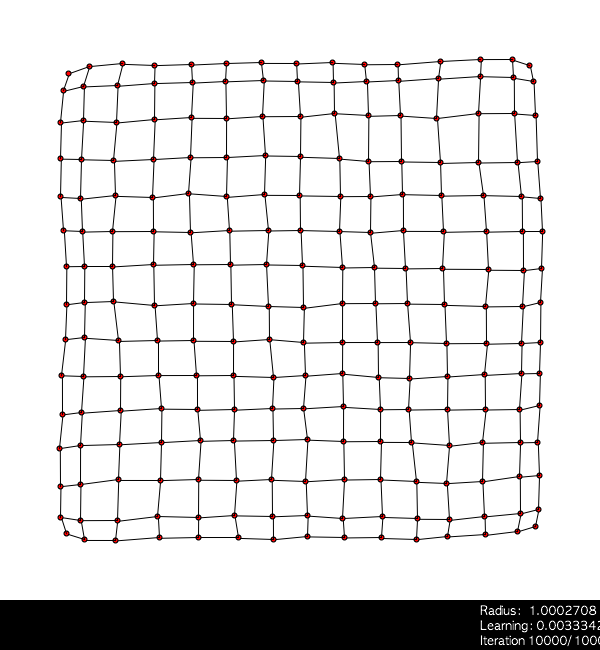
Watching the colors converge is cool, but I'm more impressed with the following example. Using a 15x15 array of nodes, I give each node a two-dimensional input then plot according to the value of the weights as x-y coordinates. I also draw a line from each node to it's four neighbors. (or three, if it's on the edge. or two, if it's a corner node.) With each weight initialized to a random value, the initial graph is a spaghetti mess:I select random values between 0 and 1 for each of the weights and feed 10,000 inputs. The final map:
Click to give focus, then type: g to Go, p to Pause, r to Reset. q/w to increase/decrease update radius, a/s for learning rate and z/x for iteration count. Note: changing parameters during training has undefined results.